Basic Usage
To create a Chart within Obsidian a Codeblock of the type chart is used. The Properties are set using YAML Syntax. Example:
```chart
    type: ""
    labels: []
    series:
        - title: ""
        data: []
        - title: ""
        data: []

```
The title Property can be omitted, but it is not advised to do so.
caution
You might not be able to copy the Examples directly into Obsidian, the Indentation is probably wrong and Obsidian tries to convert pasted Text to Markdown, which escapes a few important characters.
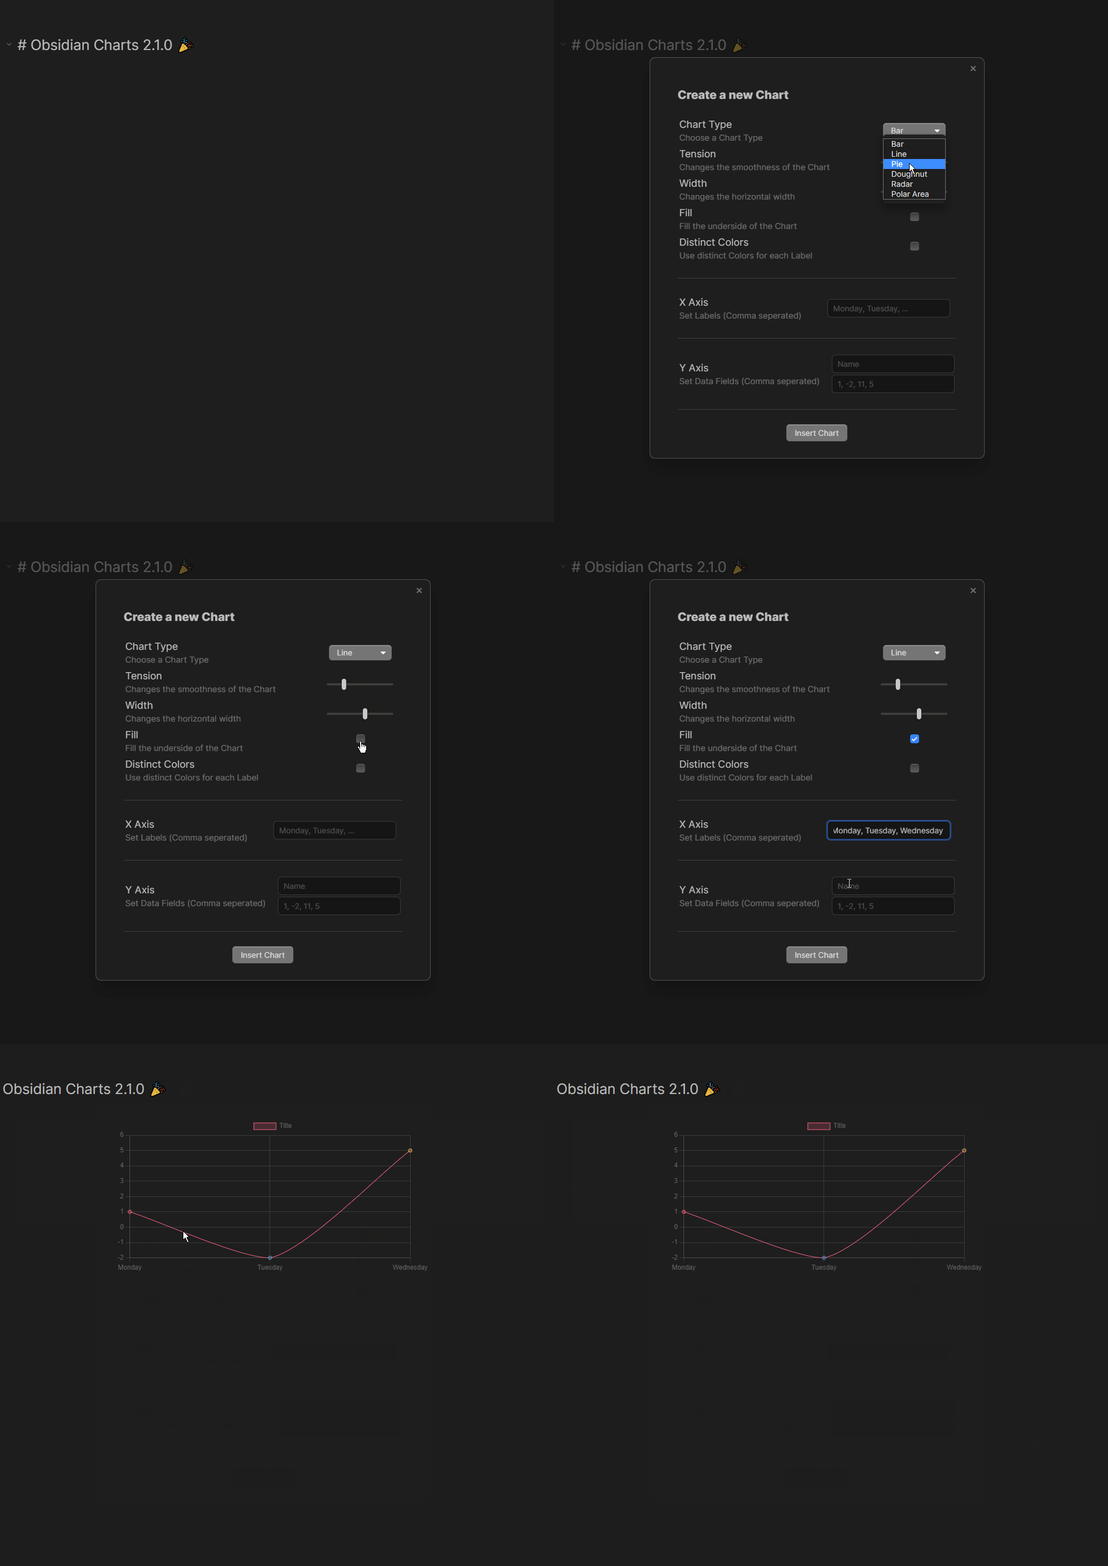
You can either manually write these Codeblocks or use the graphical Creator.
Graphical Chart Creator
For simple Charts you can use the graphical Chart Creator, you can access it via the Command Palette or you can even set a Hotkey!
